


K Map
We are a research and service division of:
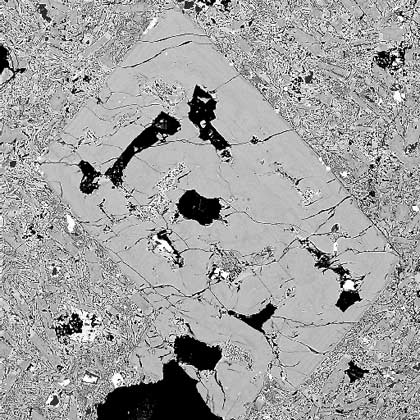
Chemical maps of sample surfaces can be produced by detecting X-rays generated from the sample surface. The following image shows the potassium (K) distribution in an altered volcanic feldspar, and the surrounding glassy matrix. The intensity of red color indicates the amount of K present on the sample surface. A backscattered image of the same feldspar can be seen below the K map.
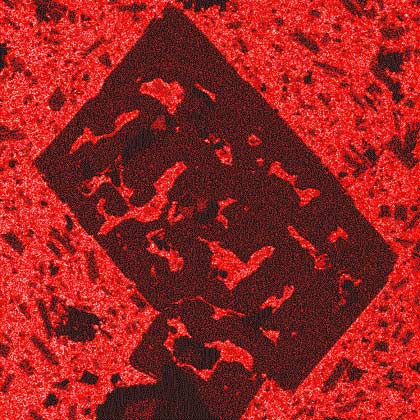
Field of view is 400 microns
Back to: what is a microprobe?